4.Data Reduction
The basic units utilized by geokon for measurement and reduction of data from vibrating wire displacement transducers are digits. Calculation of digits is based on the following equation:
equation 1: Digits Calculation
To convert digits to displacement the following equation applies:
Duncorrected = (R1 – R0) x G x F
equation 2: Displacement Calculation
Where:
R1 is the current reading.
R0 is the initial reading, usually obtained at installation.
G is the gauge factor, usually millimeters or inches per digit.
F is an optional engineering units conversion factor (see the table below).
|
To |
Inches |
Feet |
Millimeters |
Centimeters |
Meters |
|
Inches |
1 |
12 |
0.03937 |
0.3937 |
39.37 |
|
Feet |
0.0833 |
1 |
0.003281 |
0.03281 |
3.281 |
|
Millimeters |
25.4 |
304.8 |
1 |
10 |
1000 |
|
Centimeters |
2.54 |
30.48 |
0.10 |
1 |
100 |
|
Meters |
0.0254 |
0.3048 |
0.001 |
0.01 |
1 |
table 2: Engineering Units Conversion Multipliers
For example, if the initial reading R0 is 6783 digits, the current reading, R1, is 7228. The calibration factor, G, is 0.011906 mm/digit. The displacement change is:
+5.3 mm = (7228 – 6783) x 0.011906
equation 3: Displacement Change
Note that increasing readings (digits) indicate increasing extension.
geokon’s vibrating wire displacement transducers have a small coefficient of thermal expansion. Correction may not be necessary in most cases. However, to achieve maximum accuracy, there are corrections that you can apply.
Use the following equation to provide thermal correction of the instrument:
Dcorrected = G(R1 – R0) + K(T1 – T0)
equation 4: Thermally-Corrected Displacement Calculation
Where:
R1 is the current reading
R0 is the initial reading
G is the linear gauge factor
T1 is the current temperature
T0 is the initial temperature
K is the thermal coefficient (see Equation 5)
Tests have determined that the thermal coefficient, K, changes with the position of the transducer shaft. The first step in the temperature correction process is determination of the proper thermal coefficient based on the following equation:
K = ((R1 x M) + B) x G
equation 5: Thermal Coefficient Calculation
Where:
R1 is the current reading
M is the multiplier
B is the constant
G is the linear gauge factor from the supplied calibration sheet.
|
Model: |
Multiplier (M): |
Constant (B): |
|
4450-3 mm (0.125") |
0.000520 |
3.567 |
|
4450-12 mm (0.5") |
0.000375 |
1.08 |
|
4450-25 mm (1") |
0.000369 |
0.572 |
|
4450-50 mm (2") |
0.000376 |
0.328 |
|
4450-100 mm (4") |
0.000398 |
0.0864 |
|
4450-150 mm (6") |
0.000384 |
-0.3482 |
|
4450-200 mm (8") |
0.000396 |
-0.4428 |
|
4450-230 mm (9") |
0.000403 |
-0.5016 |
|
4450-300 mm (12") |
0.000424 |
-0.6778 |
table 3: Thermal Coefficient Calculation Constants
Consider the following example using a Model 4450-200 mm displacement transducer:
R0 = 4250 digits
R1 = 5875 digits
T0 = 10 °C
T1 = 20 °C
G = 0.06152 mm/digit
K = (((5875 x 0.000369) + 0.572) x 0.06152) = 0.0168
Dcorrected = ((R1 – R0) x G) + ((T1 – T0) x K)
Dcorrected = ((5875 – 4250) x 0.006152) + ((20 – 10) x 0.0168)
Dcorrected = 9.997 + 0.168
Dcorrected = +10.165 mm
The temperature coefficient of the mass or member to which the displacement transducer is attached should also be taken into account. Use the temperature coefficient of the mass or member, combined with the changes in temperature from initial to current readings, to determine thermal effects of the mass or member.
Because the purpose of using a displacement transducer is to monitor site conditions, factors which may affect these conditions should always be observed and recorded. Seemingly minor effects may have a real influence on the behavior of the structure being monitored and may give an early indication of potential problems. Some of these factors include, but are not limited to: blasting, rainfall, tidal levels, excavation and fill levels and sequences, traffic, temperature and barometric changes, changes in personnel, nearby construction activities, seasonal changes, etc.12:
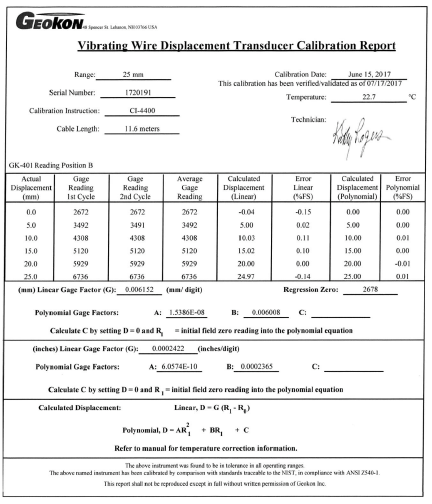
Figure 12: Typical Calibration Sheet