6.Data Reduction
The digits displayed by the geokon Models GK-404, GK-405, and GK-406 readouts on channel B are based on the equation:
equation 1: Digits Calculation
Note that in the above equation, the period is in seconds; geokon readout boxes display microseconds. For example, a piezometer reading of 8000 digits corresponds to a period of 354 µs and a frequency of 2828 Hz.
Digits are directly proportional to the applied pressure, as can be seen by the following equation:
Pressure = (Current Reading – Initial Zero Reading) × Linear Calibration Factor
Or
P = (R1 – R0) × G
equation 2: Convert Digits to Pressure
Since the linearity of most sensors is within ±0.2% F.S., the errors associated with nonlinearity are of minor consequence. However, for those situations requiring the highest degree of accuracy, it may be desirable to use a second order polynomial to get a better fit of the data points. The use of a second order polynomial is explained in Appendix C.
The instrument’s calibration report (a typical example of which is shown in Appendix D), shows the data from which the linear gauge factor and the second order polynomial coefficients are derived. Columns on the right show the size of the error incurred by assuming a linear coefficient and the improvement that can be expected by going to a second order polynomial. In many cases, the difference is minor. The calibration report gives the pressure in certain engineering units. These can be converted to other engineering units using the multiplication factors shown in Table 2.
|
From To |
psi |
"H2O |
'H2O |
mm H20 |
m H20 |
"HG |
mm HG |
atm |
mbar |
bar |
kPa |
MPa |
|
psi |
1 |
.036127 |
.43275 |
.0014223 |
1.4223 |
.49116 |
.019337 |
14.696 |
.014503 |
14.5039 |
.14503 |
145.03 |
|
"H2O |
27.730 |
1 |
12 |
.039372 |
39.372 |
13.596 |
.53525 |
406.78 |
.40147 |
401.47 |
4.0147 |
4016.1 |
|
'H2O |
2.3108 |
.08333 |
1 |
.003281 |
3.281 |
1.133 |
.044604 |
33.8983 |
.033456 |
33.4558 |
.3346 |
334.6 |
|
mm H20 |
704.32 |
25.399 |
304.788 |
1 |
1000 |
345.32 |
13.595 |
10332 |
10.197 |
10197 |
101.97 |
101970 |
|
m H20 |
.70432 |
.025399 |
.304788 |
.001 |
1 |
.34532 |
.013595 |
10.332 |
.010197 |
10.197 |
.10197 |
101.97 |
|
"HG |
2.036 |
.073552 |
.882624 |
.0028959 |
2.8959 |
1 |
.03937 |
29.920 |
.029529 |
29.529 |
.2953 |
295.3 |
|
mm HG |
51.706 |
1.8683 |
22.4196 |
.073558 |
73.558 |
25.4 |
1 |
760 |
.75008 |
750.08 |
7.5008 |
7500.8 |
|
atm |
.06805 |
.002458 |
.029499 |
.0000968 |
.0968 |
.03342 |
.001315 |
1 |
.000986 |
.98692 |
.009869 |
9.869 |
|
mbar |
68.947 |
2.4908 |
29.8896 |
.098068 |
98.068 |
33.863 |
1.3332 |
1013.2 |
1 |
1000 |
10 |
10000 |
|
bar |
.068947 |
.002490 |
.029889 |
.0000981 |
.098068 |
.033863 |
.001333 |
1.0132 |
.001 |
1 |
.01 |
10 |
|
kPa |
6.8947 |
.24908 |
2.98896 |
.0098068 |
9.8068 |
3.3863 |
.13332 |
101.320 |
.1 |
100 |
1 |
1000 |
|
MPa |
.006895 |
.000249 |
.002988 |
.0000098 |
.009807 |
.003386 |
.000133 |
.101320 |
.0001 |
.1 |
.001 |
1 |
table 2: Engineering Units Multiplication Factors
Note: Due to changes in specific gravity with temperature, the factors for mercury and water in the above table are approximate.
The materials used in the construction of geokon vibrating wire piezometers have been carefully selected to minimize thermal effects; however, most units still have a slight temperature coefficient. Consult the calibration report supplied with the instrument to obtain the coefficient for the individual piezometer.
Since piezometers are normally installed in a tranquil and constant temperature environment, corrections are normally not required. If this is not the case for the selected installation, corrections can be made using the internal thermistor for temperature measurement. See Section 5.3 for instructions regarding obtaining the piezometer temperature.
The temperature correction equation is as follows:
Temperature Correction = (Current Temperature – Initial Zero Temperature) × Thermal Factor
Or
PT = (T1 – T0) × K
equation 3: Temperature Correction
The calculated correction would then be added to the pressure calculated using Equation 2. If the engineering units were converted, remember to apply the same conversion to the calculated temperature correction.
For example, if the initial temperature was 22 °C, and the current temperature is 15 °C, and the thermal factor (K on the calibration report) is +0.1319 kPa per °C rise. The temperature correction is +0.1319(15–22) = –0.92 kPa. Refer to the calibration report provided with the instrument for the thermal factor.
6.3Barometric Correction (required only on unvented transducers)
Since the standard piezometer is hermetically sealed, it responds to changes in atmospheric pressure. Corrections may be necessary, particularly for the sensitive, low-pressure models. For example, a barometric pressure change from 29 to 31 inches of mercury would result in approximately one psi of error (or ≈ 2.3 feet if monitoring water level in a well). It is advisable to read and record the barometric pressure every time the piezometer is read. Having an onsite barometer also allows the monitoring of barometric changes to judge what extent they may be affecting the reading. A separate pressure transducer (piezometer), kept out of the water, may also be used for this purpose.
The barometric correction equation is as follows:
Barometric Correction = (Current Barometer – Initial Zero Barometer) × Conversion Factor
Or
PB = (S1 – S0) × F
equation 4: Barometric Correction
The calculated barometric correction is subtracted from the pressure calculated using Equation 2. If the engineering units were converted, remember to apply the same conversion to the calculated barometric correction.
Barometric pressure is usually recorded in inches of mercury. The conversion factor for inches of mercury to psi is 0.491, and from inches of mercury to kPa is 3.386. Table 2 in Section 6.1 lists other common conversion factors.
The user should be cautioned that this correction scheme assumes ideal conditions. Conditions are not always ideal. For example, if the well is sealed, barometric effects at the piezometer level may be minimal or attenuated from the actual changes at the surface. Thus, errors may result from applying a correction that is not required. In these cases, geokon recommends independently recording the barometric pressure changes and correlating them with the observed pressure changes to arrive at a correction factor.
An alternative to making barometric corrections is to use piezometers that are vented to the atmosphere (see Section 6.4). However, vented piezometers only make sense if the piezo is in an open well or standpipe and the user is only interested in the water level. If the piezo is buried it is not certain that the full effect of the barometric change will be felt immediately at the instrument and is more likely to be attenuated and delayed, in which case a vented piezo would automatically apply a correction that is too large and too soon.
The equation below shows the pressure calculation with temperature and barometric correction applied.
Pcorrected = (R1 – R0)G + (T1 – T0)K – (S1 – S0)F
equation 5: Corrected Pressure Calculation
6.4Model 4500SV, Vented Piezometers
13:
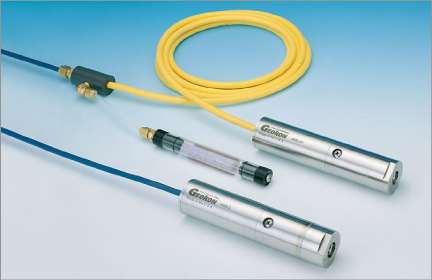
Figure 13: Vented Piezometers
The Model 4500SV vented piezometer is designed to eliminate the effect of barometric pressure changes on water level measurements in wells, reservoirs, and boreholes that are connected directly to the atmosphere. They are not to be used where pore water pressures are being measured.
The space inside the transducer is not hermetically sealed and evacuated, as it is in the standard 4500 model piezometer, instead, it is connected via a tube (integral within the cable) to the atmosphere. A chamber containing desiccant capsules is attached to the outer end of this tube to prevent moisture from entering the transducer cavity. Vented piezometers require more maintenance then unvented types, since there is always the danger that moisture may find its way inside the transducer and ruin it.
Installation of the piezometer is accomplished by lowering it to the desired level in the well, reservoir, or borehole. The piezometer can be placed inside a canvas bag filled with sand, if desired.
The desiccant capsule chamber needs to be positioned in some kind of housing to keep it dry. geokon can provide suitable housings on request.
To keep the desiccant fresh during storage and transportation, the end of the desiccant chamber is closed off by means of a seal screw before being shipped from the factory. THIS SEAL SCREW MUST BE REMOVED BEFORE THE PIEZOMETER IS PUT INTO SERVICE.
The desiccant capsules are blue when fresh. They will gradually turn pink as they absorb moisture. When they have turned light pink in color, they should be replaced. Contact geokon for replacement capsules.
Since the purpose of the piezometer installation is to monitor site conditions, factors that can affect these conditions should always be observed and recorded. Seemingly minor affects may have a real influence on the behavior of the structure being monitored and may give an early indication of potential problems. Some of these factors include, but are not limited to, blasting, rainfall, tidal levels, traffic, temperature and barometric changes, weather conditions, changes in personnel, nearby construction activities, excavation and fill level sequences, seasonal changes, etc.