 Loading... Please wait...
-
Products
- Piezometers
- Inclinometers
- Strain Gauges
- Data Loggers
- Time Domain Reflectometry (TDR)
- Displacement Transducers
- Extensometers
- Settlement Sensors
- Pressure Cells
- Load Cells
- Tiltmeters · Pendulums
- Readouts
- Visualization Software
- Stressmeters
- Distributed Fiber Optic Sensors
- Temperature
- Instrumentation Cables
- DeAerators
- Vibration Monitoring
- Custom Instrumentation
- Discontinued
- Support
- Training
- Contact Us
- News
- Company
- Projects
- Resources
- Videos
- Links
Resources
Session 04
Geotechnical Instrumentation Data Analysis Tips and Tricks
(Part 2 • Data Presentation, Interpretation and Reporting)
Posted November 24, 2021
Every good monitoring program consists of clear presentation of instrumentation data alongside other site metrics to present a cause-and-effect picture of how the site is performing.
The following are some tips to ensure that instrumentation data is presented in the most clear and concise manner.
Data Presentation
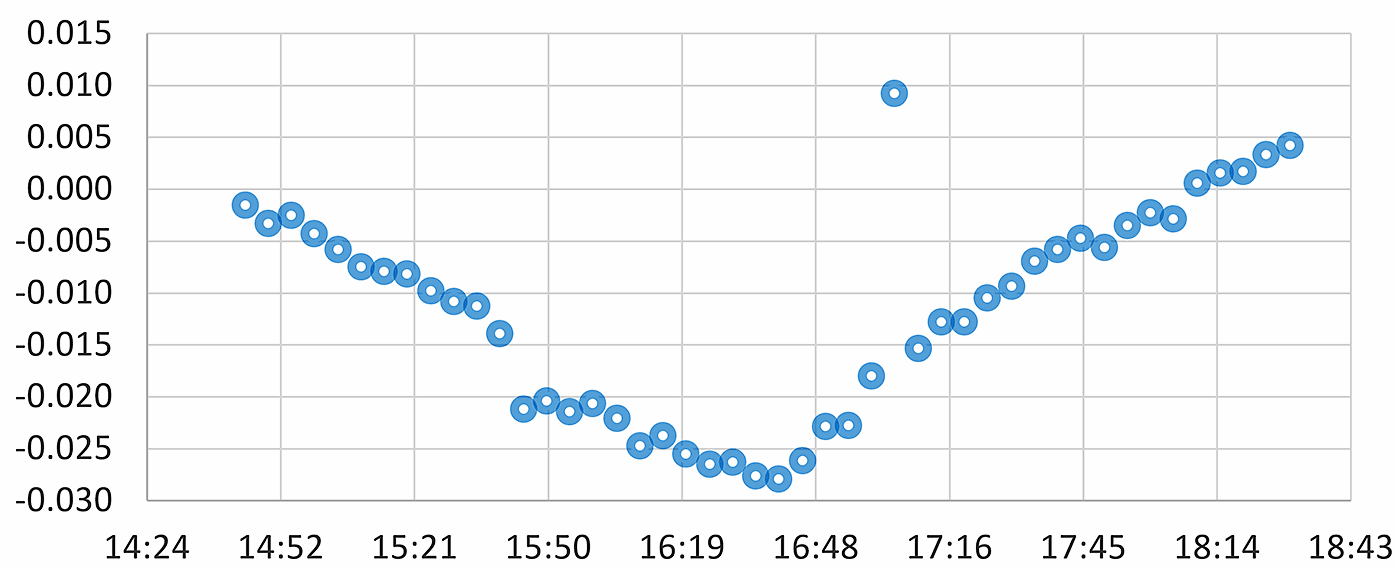
- Plots to assist data screening
- lines of best fit to smooth out data (remove outliers)
- Plot data vs time for full data set
- to assess data quality and show trends
- Plots showing observed vs predicted behavior
- plotted regarding time and on same axis
- Plots comparing measurements and observations
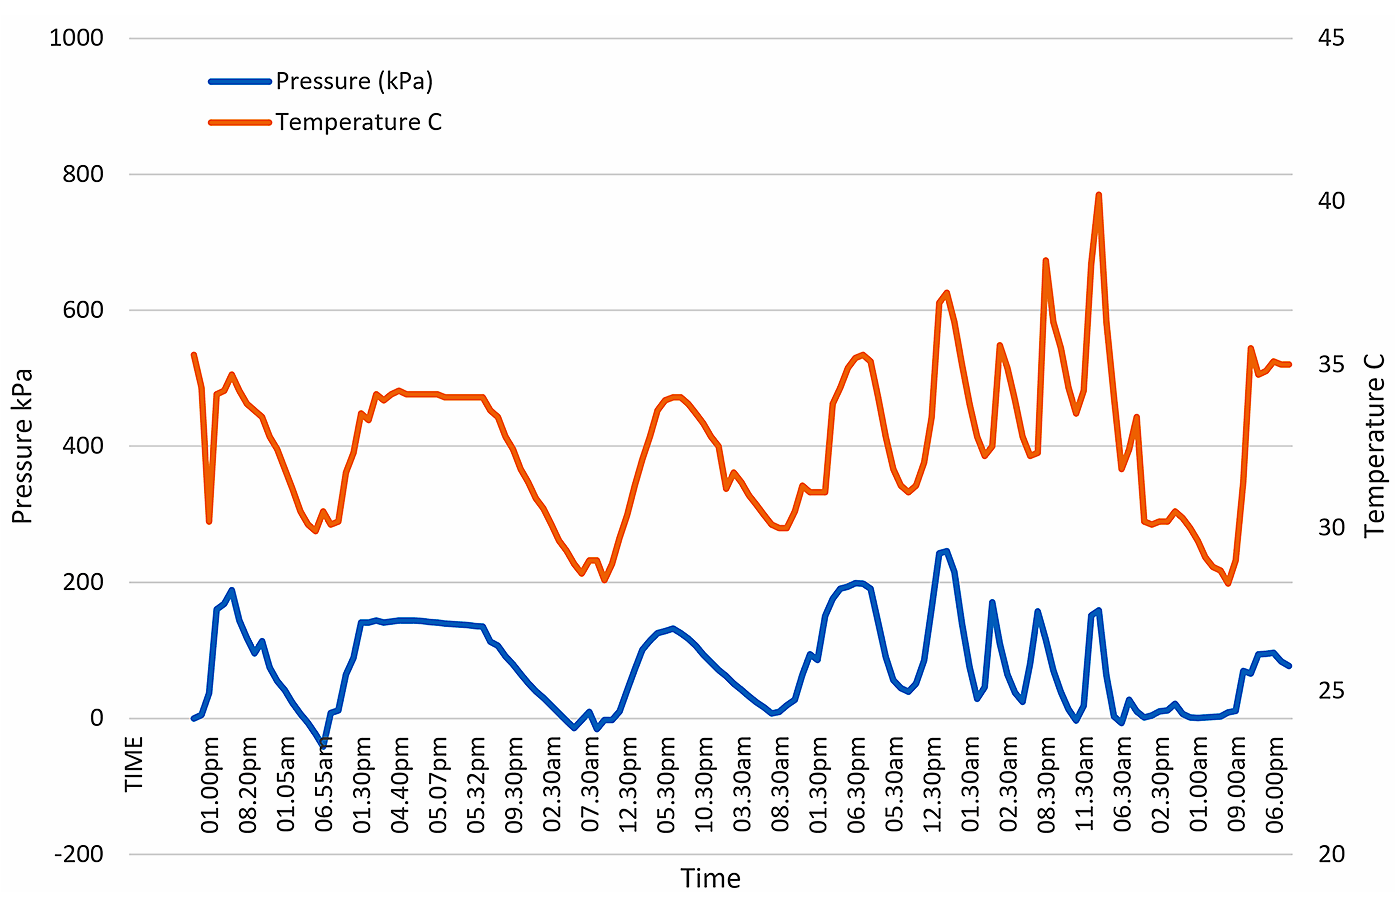
- often form part of data interpretation
- plotted regarding time and on same axis
- e.g., fill placement, pond level, rainfall, and pore water pressure
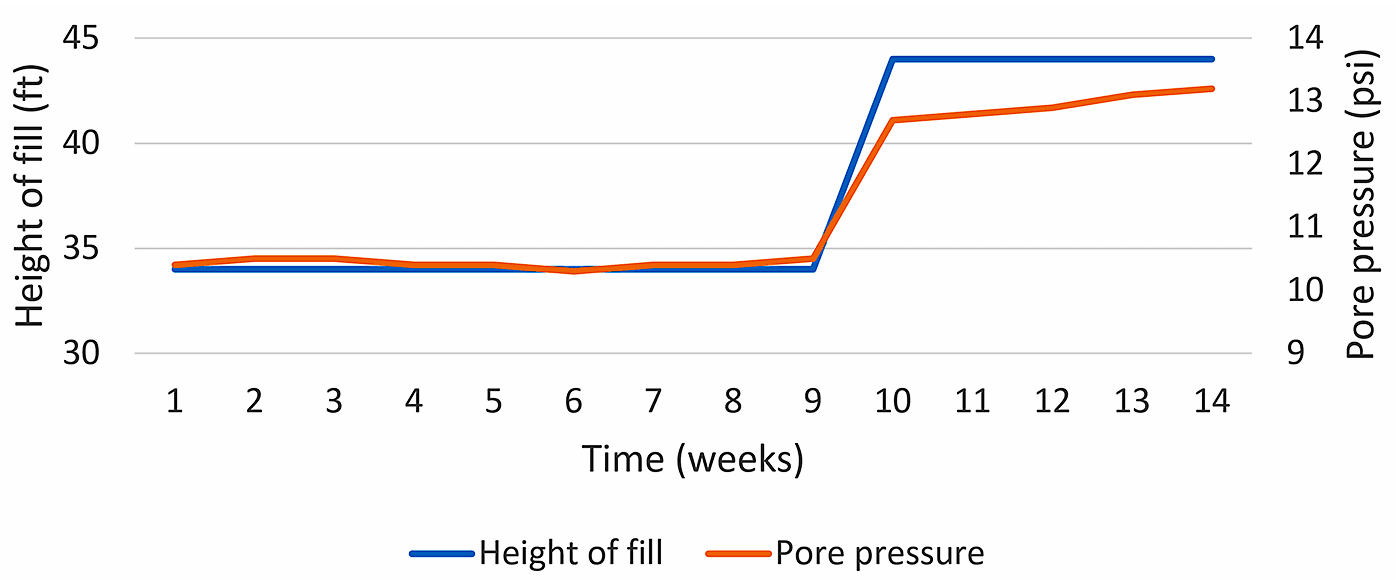
- Plots to examine cause and effect relationships
- e.g., pore pressure increase and settlement as a function of fill placement
- Determine the magnitude of change in the monitoring parameters required to validate performance of the structure
- and verify that the proposed instruments can detect that magnitude of change
- Plot error bands on all data sets to assist in interpreting actual change in conditions vs possible sensor errors
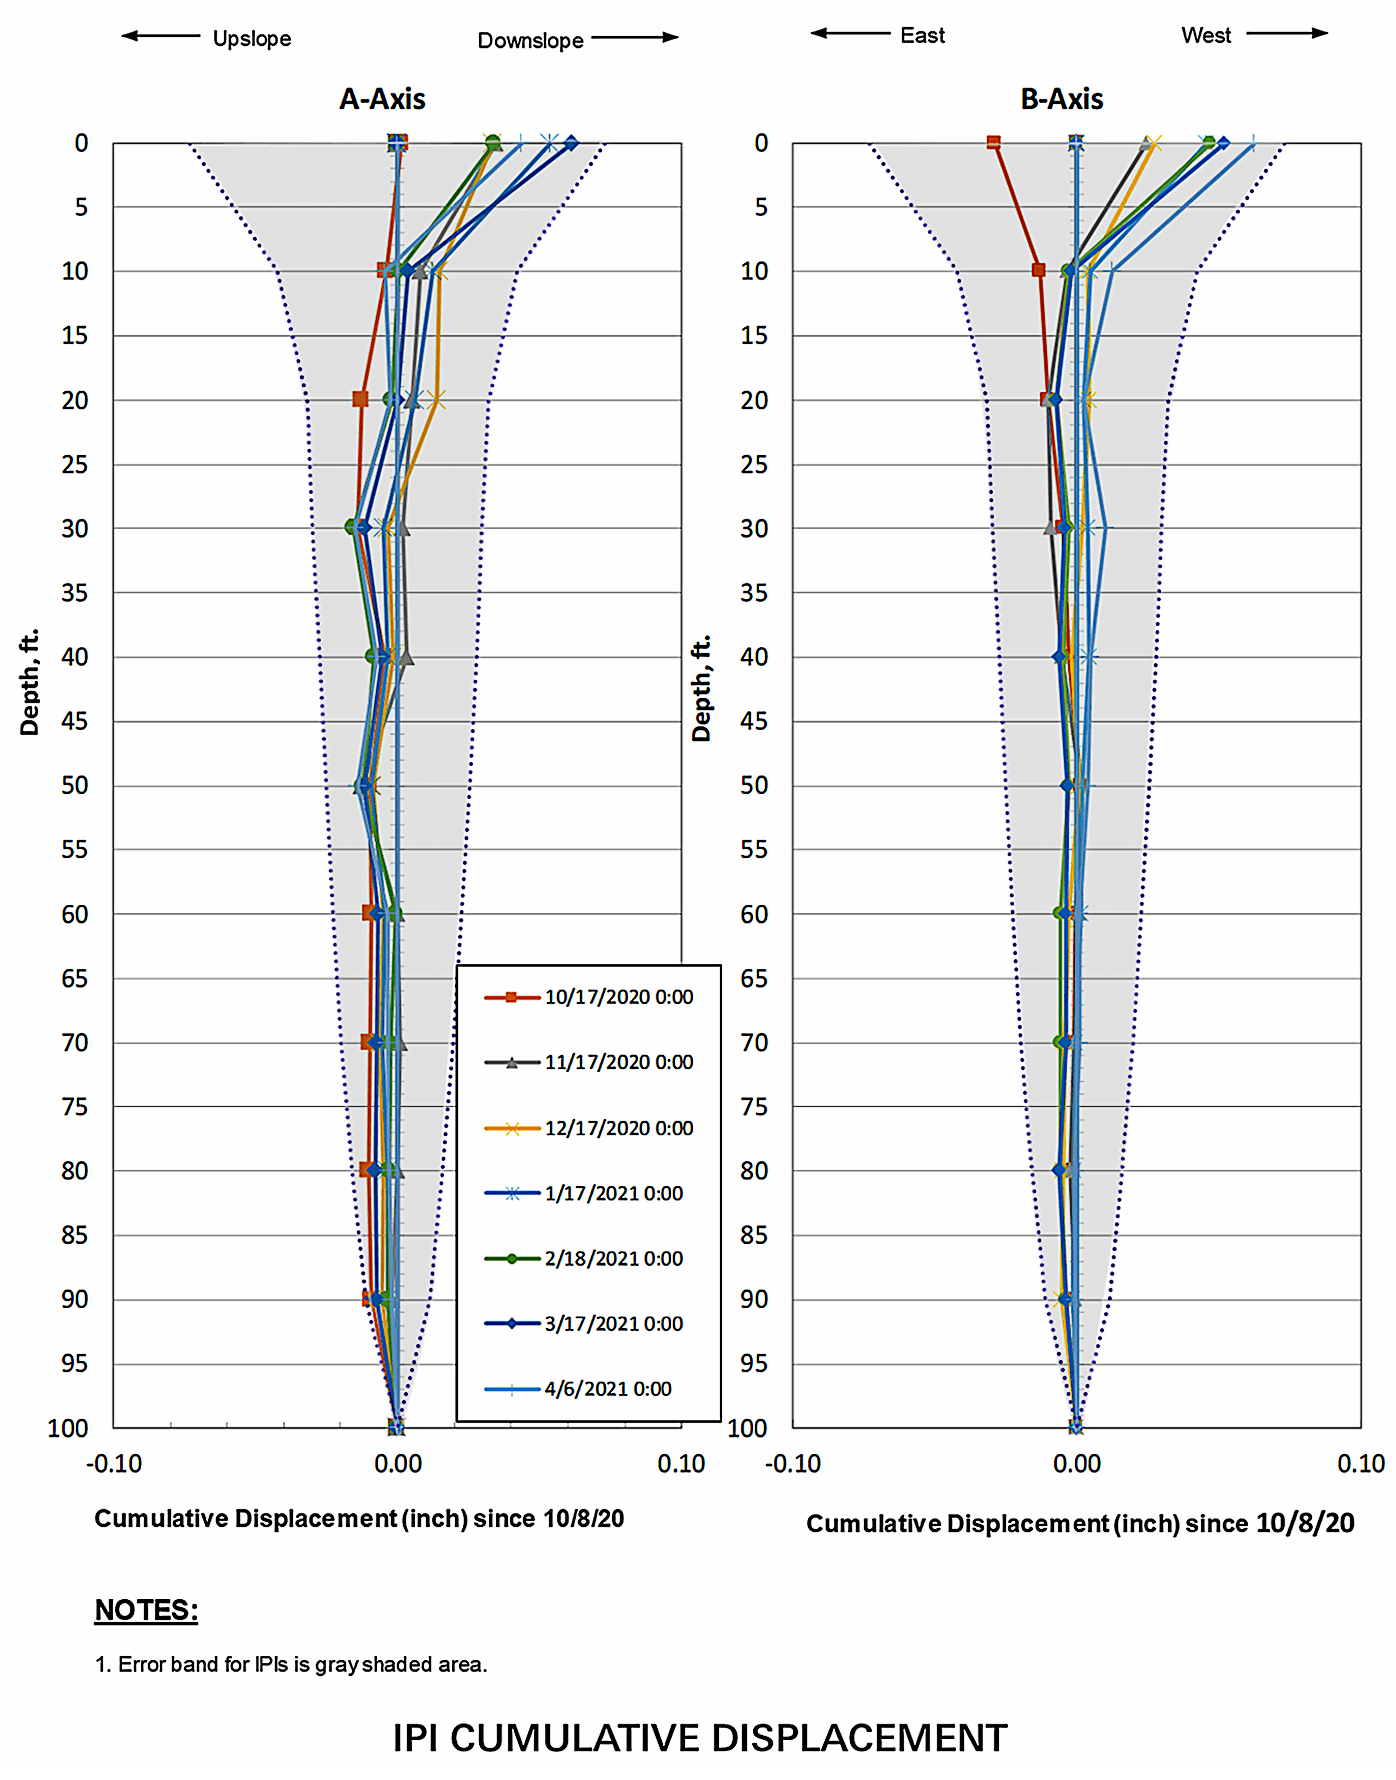
- Can the instruments you selected be sampled by the proposed system at the frequency required by your monitoring plan?
Data Interpretation
- Qualified personnel
- Follow a pre-determined procedure
- Do not delay interpretation
- data collection, processing and interpretation influence each other
- Create plots with meaningful interpretation in mind
- e.g., units from a MEMS IPI sensor can be displayed in:
- Raw data digits
- Acceleration in g
- Tilt in radians
- Tilt in degrees
- Displacement in mm/m or in/ft
- e.g., units from a MEMS IPI sensor can be displayed in:
- First reaction is to reject unanticipated readings and/or blame the sensor, but data may be real (and be important)
- Consult with manufacturer to better understand performance of the instrument in question
- Ask “Can I think of a hypothesis that is consistent with the data”
- check reading correctness to assess data validity
- zero readings, gage factors, temperature corrections, barometric pressure, datalogger programs/power
- check raw data
- check installation records | difficulties encountered during install
- site and environmental conditions
- Construction, rainfall, headpond level
- check reading correctness to assess data validity
Compare Instrumentation data with design models
- Before reviewing data get a feel for what the values should be based on the design model and existing conditions
- How sensitive are model results to input parameters (parametric studies should be undertaken to show a range of expected results based on variation in soil type, water level, temperature etc.)
- Are there any localized conditions that could result in variations from the modelled section?
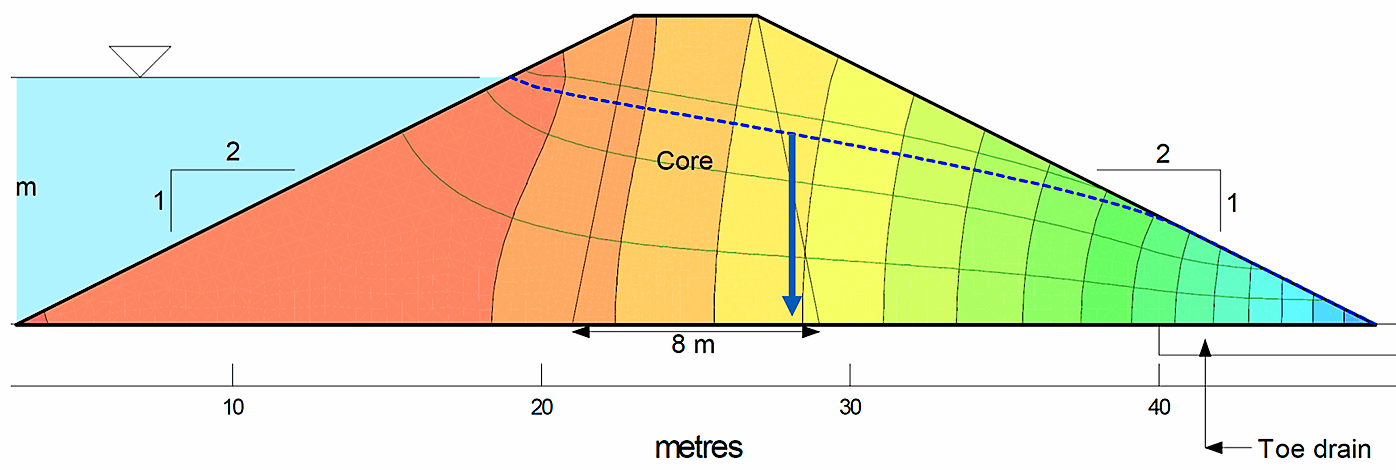
VW Piezometer installation location and predicted water level | Reference: www.geostudio.com
Screen the data for expected site conditions vs. actual site conditions
- Before reviewing instrumentation data make sure the site conditions and change in those conditions with time is understood
- Construction data is often not synced to instrumentation data making it difficult to determine the loads the instruments are subjected to at the time of the readings
- There can be disconnects between the engineer(s) reviewing the instrumentation data and the designer/construction inspector
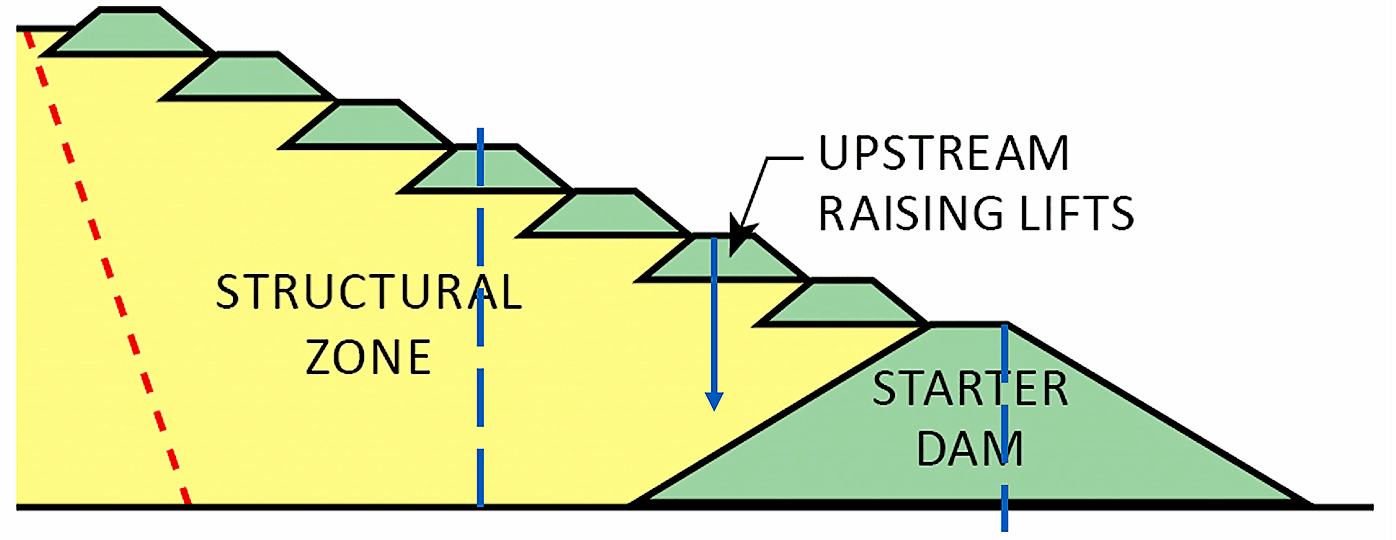
Reference: www.klohn.com/blog/best-practices-for-tailings-dam-design
Reporting
- Conclusions, drawn from interpretations must be:
- Reported and submitted
- to those responsible for implementation of data on a regular schedule
- Reported and submitted
- Final report to include
- introduction, why are we monitoring
- any design and construction information relative to monitoring program
- summary of monitoring program plan
- description of instruments and readouts and calibration procedures
- plans and sections
- surface and subsurface geotechnical data
- procedures for data collection, processing, presentation, and interpretation
- observed behavior with measured data and influencing factors and predicted behavior
- conclusions, discussion, and remedial action
- assessment of monitoring program along with suggested improvements
