 Loading... Please wait...
-
Products
- Piezometers
- Inclinometers
- Strain Gauges
- Data Loggers
- Displacement Transducers
- Extensometers
- Settlement Sensors
- Pressure Cells
- Load Cells
- Tiltmeters · Pendulums
- Readouts
- Visualization Software
- Stressmeters
- Distributed Fiber Optic Sensors
- Temperature
- Instrumentation Cables
- DeAerators
- Vibration Monitoring
- Custom Instrumentation
- Discontinued
- Support
- Training
- Contact Us
- News
- Company
- Projects
- Resources
- Videos
- Links
Resources
GEO Blog
Session 05
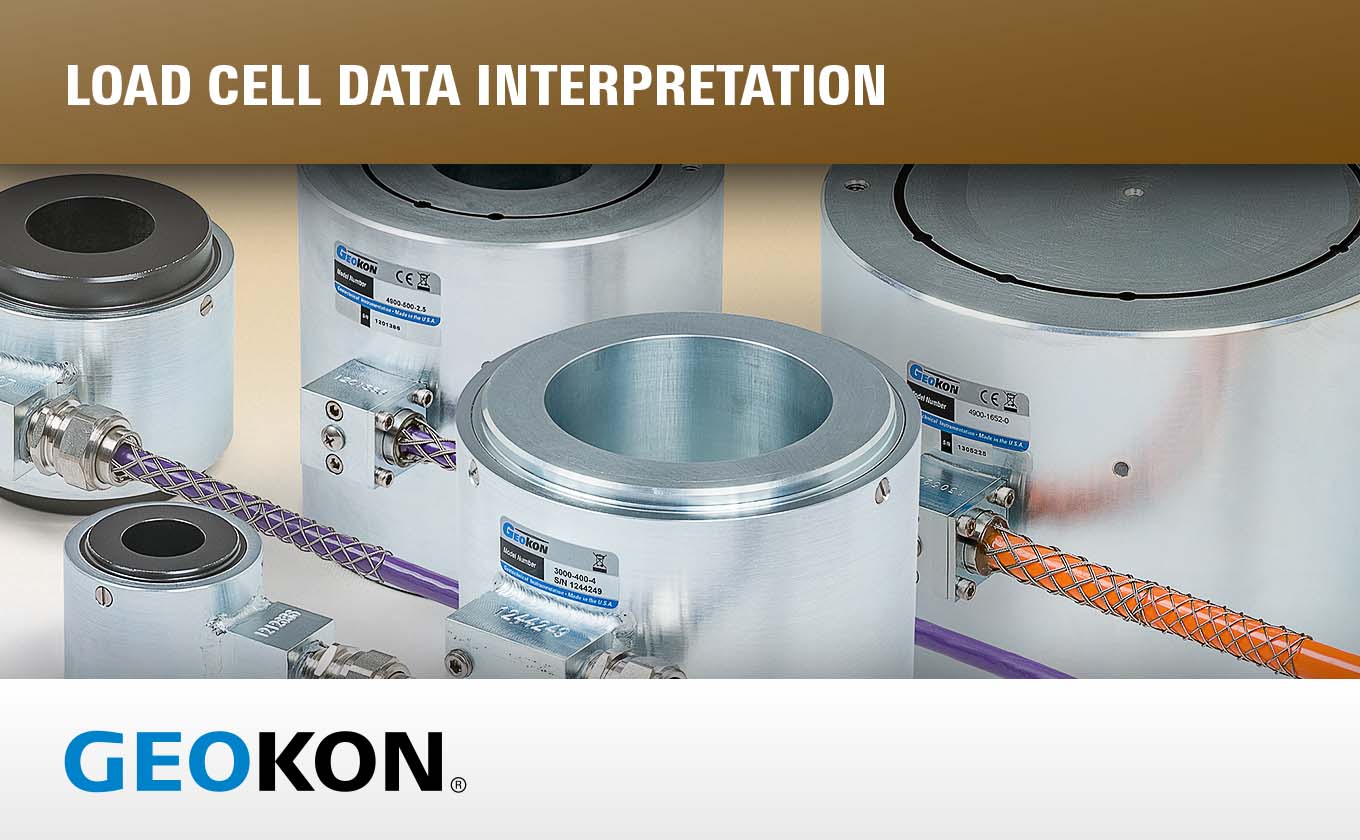
Load Cell Data Interpretation
Posted April 08, 2022
A question that often surfaces when using load cells is why the load cell readings and applied pressure gauge readings do not match…
Session 04
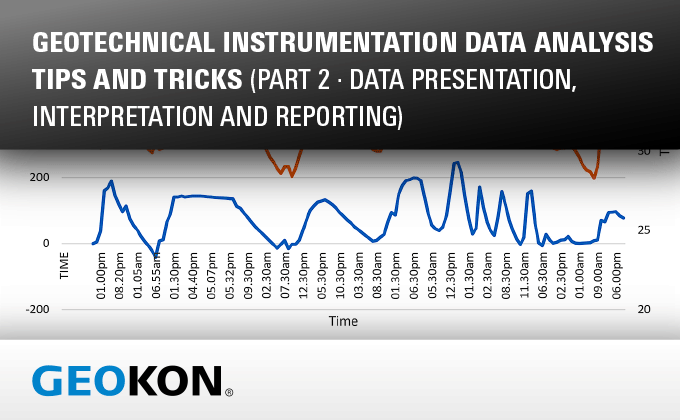
Geotechnical Instrumentation Data Analysis Tips and Tricks (Part 2 • Data Presentation, Interpretation and Reporting)
Posted November 24, 2021
Every good monitoring program consists of clear presentation of instrumentation data alongside other site metrics to present a cause-and-effect picture…
Session 03
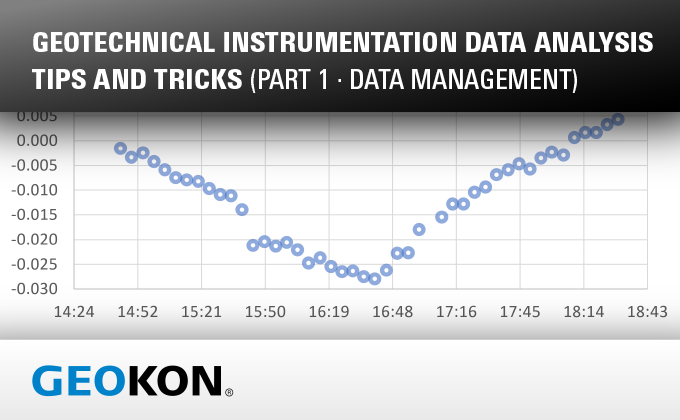
Geotechnical Instrumentation Data Analysis Tips and Tricks (Part 1 • Data Management)
Posted November 18, 2021
Geotechnical instrumentation data analysis starts with good planning…
Session 02
A Geotechnical Engineer’s Guide to MEMS Accelerometer Specifications (Part 2 • Practical Use for IPI Data Interpretation)
Posted June 28, 2021
Geotechnical instrumentation suppliers often use off the shelf MEMS sensors and typically apply some in-house calibration and sample averaging to help…
Session 01
A Geotechnical Engineer’s Guide to MEMS Accelerometer Specifications (Part 1 • Terminology)
Posted April 28, 2021
As a geotechnical engineer you may ask yourself, why do I care about Micro-Electro-Mechanical Systems (MEMS) accelerometers? The term MEMS…
