4.User Interface
The GK-604D IRA user interface contains several navigation controls designed to make job of selecting application elements and functions easier. These navigation controls present an organizational view of the active workspace, inform the user about the state of the application, and provide the user with tools to configure and control geokon devices.
The GK-604D IRA User Interface is comprised of several core components:
Project Explorer:
Element selection tool. Context (dropdown) menu. Covered in Section 4.2.
Application Menu:
Allows display changes, project, hole and probe configuration and connection to the remote module. Covered in Section 4.3.
File Menu:
File and project explorer element exporting, importing and restoration. Data view/reporting options. Covered in Section 4.4.
Status Area:
Displays the currently selected hole and probe as well as application status.
The Project Explorer is the primary navigation mechanism for moving around the GK-604D IRA workspace and probe library. The Project Explorer presents a view of the workspace including projects and holes and a view of the probe library that includes available probes. These views reflect the hierarchical relationship between these elements.
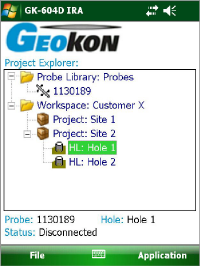
Figure 45: User Interface
The highest element in the workspace hierarchy tree is a project. Projects allow a GK-604D IRA user to group holes into organizational units based on the user's preference. A project can reflect a specific site where holes have been drilled, such as a construction project. This organizational feature makes it easy to find hole configurations along with related data files. The list of holes defined under the project can be viewed by selecting a specific project and expanding its branch in the explorer view (click on the + sign preceding project name) (see Figure 45).
In the hierarchy of the project explorer, holes are child elements of a project. Hole settings can be edited by selecting the desired hole in the explorer tree. Once selected, hole settings can be displayed using "Edit Settings" from the Application menu (see Section 4.3) or by using the context menu (see Section 4.2.1 below).
Much as a project is a child element of a workspace, a probe is a child element of a probe library.
From the Project Explorer, new workspace elements can be added using the context menu. Access the dropdown menu by tapping and holding the explorer element that is to be operated on. The context menu is context sensitive in that, based on the current selection, the appropriate elements will be enabled, and others will be disabled. Figure 46 shows the dropdown menu with the menu item, "Add Hole", enabled (not grayed out) since a "project" element is selected in the Project Explorer.
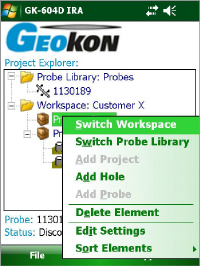
Figure 46: Context Menu
As can be seen from Figure 46, the settings for a project explorer element can also be edited from the context menu.
Note that certain explorer elements can be sorted by newest or oldest first. The elements that can be sorted in a project explorer list are: Holes, Projects, and Probes.
The GK-604D IRA Application menu (Figure 47) provides access to high level application functionality. It is in the lower, right corner of the main window frame. The Edit Settings menu subitem of this menu can also be accessed via the context menu. The Application menu subitems are further described below.
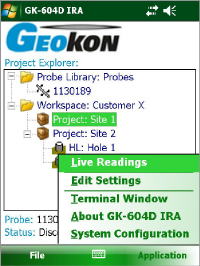
Figure 47: Application Menu
Tapping this menu item initiates the Remote Module connection process and after a successful connection, the Live Readings screen will be displayed (see Figure 52). Should the connection attempt fail, the window shown in Figure 48 will be displayed with suggestions for correcting any issues before retrying.
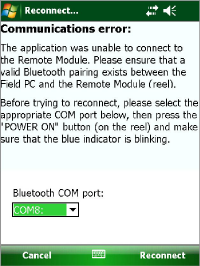
Figure 48: Remote Module Connection Problem
Note: When attempting to connect to the Remote Module, please ensure that the POWER ON/OFF (BLUETOOTH) button on the Remote Module has been pressed (blue light will be blinking) before tapping the Live Readings menu item.
After the Remote Module successfully connects to the FPC-2, the blue POWER ON indicator will transition from blinking to steadily lit and one of two possible screens will be displayed:
Screen 1 - Temporary File Data Prompt:
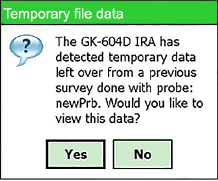
Figure 49: Temporary File Data Prompt
Figure 49 shows the message displayed if the GK-604D detects that a previous survey was not saved. Tapping "Yes" displays the temporary data (Figure 50). Tapping "No" displays the "Load previous data" prompt (see Figure 51).
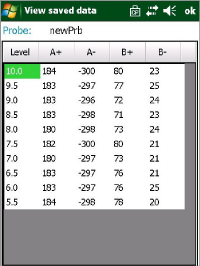
Figure 50: View Saved Data
To dismiss the "View saved data" window tap "ok" which will then display the "Load previous data" prompt (Figure 51). Tapping "Yes" on the Load previous data" window will load the temporary data into memory and then display "Live Readings" (Figure 52). Tapping "No" will load "Live Readings" as normal.
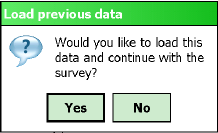
Figure 51: Load Previous Data
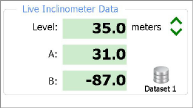
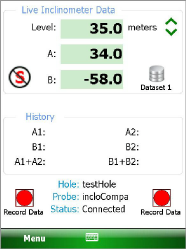
Screen 2 - Live Readings Screen:

Figure 52: Live Readings Screen
■Readings are continuously updated from the Remote Module. The data set always starts with "Dataset 1" but can be switched at any time to "Dataset 2" (usually after rotating the probe 180 degrees).
■At the start of a survey, the "Level" is set to the "Starting Level" configured for a particular hole. Pressing either Record Data button (with a finger or tap of the stylus) records that set of A and B values and automatically changes the "Level" (on screen) by the amount based on the hole configuration "Interval" value (see Section 5.1). The "Record Data" option can also be activated by pressing the "Enter" key on the lower-right side of the keypad.
■A "beep" sound should be heard, confirming that the reading has been stored. If no beep is heard, tap the "volume" control at the top of the screen and adjust the volume.
■Be sure to move the probe to the new level and wait for the readings to stabilize before recording the next reading.
■At any point you can scroll the "Level" using the green up and down arrow buttons on the screen and view data stored and checksums (lower half of the screen). When done taking readings, tap "Menu" (lower-left corner of the screen), followed by "Exit Live Readings". You will be given the option to save the readings to a file (Figure 53).
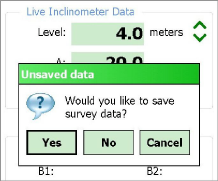
Figure 53: Unsaved Data Prompt
nEven if you select No, the readings will be saved to a temporary file and can be restored the next time "Live Readings" is entered.
nIf Yes is selected, you then will be given the choice of saving with the auto-increment suffix on the standard filename (Figure 54). Selecting Yes again causes the save operation to be carried out using a filename of the form: [Hole_Name][3 digit AutoIncr_Suffix].GKN
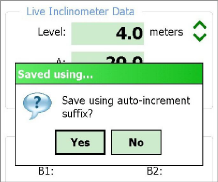
Figure 54: Auto Increment Save
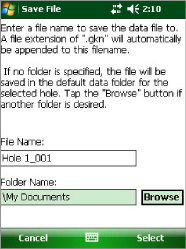
nIf No is selected, you will be shown the standard File Save As screen (Figure 55) and you can modify the file name to anything you choose. Use the stylus to click on the keyboard icon (bottom) and make the changes you desire.
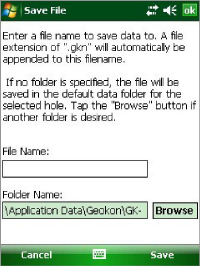
Figure 55: Save File Screen
See Section 4.3.5 for more information about options that affect Live Readings and taking surveys.
Live Readings Screen Menu Options
Figure 56 shows the available options from the Live Readings menu when a Digital Inclinometer/Compass probe is detected. These options are described below.
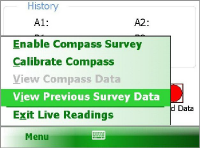
Figure 56: Menu Option (Live Readings Screen)
Enable Compass Survey:
Note: This menu item is only shown if a compass probe is detected. Though all new probes have a built-in compass, previously sold GK-604D systems must have been sold with a reel firmware version of V2.7 (or greater) AND a probe firmware version of V2.7 (or greater) to have the included compass.
The compass sensor coupled with two axes of MEMS, Compass Survey of the selected hole at the same time as the inclinometer survey.
Tapping the menu option, "Enable Compass Survey", will display the message shown (in red) in Figure 57 for approximately five seconds and will enable the compass survey option. This message informs the user that, with the compass enabled; an inclinometer survey will take approximately 30% longer.
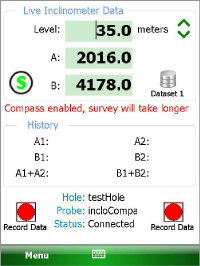
Figure 57: Compass Enable Message
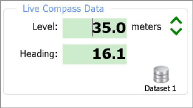
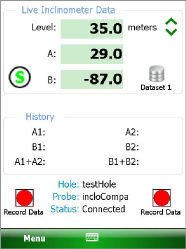
With the compass enabled, a survey is performed as normal (see Section 4.3.1) and the compass heading can be displayed at any level by tapping "Menu->View Compass Data", displaying the screen shown in Figure 58.
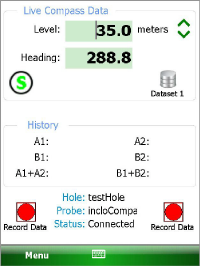
Figure 58: Live Compass Data
While live compass data is being shown, "Live Inclinometer Data" can be redisplayed at any time by tapping "Menu->View Inclinometer Data".
When the survey is finished, tap "Menu->Exit Live Readings". The "Unsaved data" prompt (Figure 59) will be displayed. Tap "Yes" to save the inclinometer/compass survey data.
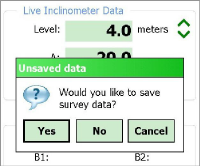
Figure 59: Unsaved Data Prompt
The inclinometer survey data is saved into a ".gkn" file as normal while the compass survey data is saved into a ".gks" file. The ".gks" file format is supported by SiteMaster inclinometer analysis software and is very similar to standard inclinometer survey data with the following exceptions:
■A+ data is always in degrees.
■A- and B- are always zero (0)
■B+ data is always 90 degrees greater than A+
The compass data file can be viewed (select "Raw Data as Table") and/or exported for later use in analysis. See Appendix C.6 for an example ".gks" file.
Calibrate Compass:
For optimum accuracy, the digital inclinometer/compass probe should be calibrated for each site. The GK-604D IRA provides a dialog to facilitate this (see Live Readings Screen Menu Options and Figure 56). A compass survey does not need to be enabled to perform the calibration.
While the GK-604D IRA is connected to the probe and displaying the "Live Readings" screen, tap "Menu->Calibrate Compass" to display the initial calibration screen (Figure 60).
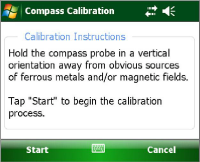
Figure 60: Initial Calibration Screen
Tapping "Start" begins the calibration process (Figure 61).
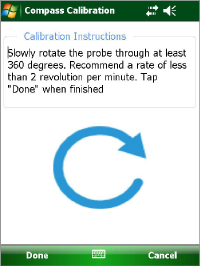
Figure 61: Calibration Routine
As the instructions state, the probe should be held in an upright position and slowly rotated through at least 360 degrees. The large rotating blue "arrow" serves two purposes: one, it indicates to the user that the probe should be turned and two, it provides feedback that the calibration routine is still running. Tapping "Done" sends a command to the probe that calibration is finished, and the Live Readings screen is redisplayed.
View Compass Data:
When a compass survey is enabled, this menu item is also enabled, allowing the compass heading to be displayed in place of the inclinometer "A" data. This item toggles between "View Inclinometer Data" (Figure 62) and "View Compass Data" (Figure 63) depending on the data currently being viewed. This menu item is only shown if a compass probe is detected.

View Previous Survey Data:
Allows viewing (and loading) of previous survey data. When tapped, the user must first select the previous survey file to view. After selecting a file, a window very similar to Figure 64 will be displayed. After dismissing this window another prompt is displayed similar to Figure 65. Tap "Yes" to load the data or "No" to continue with the current survey.

Figure 64: View Saved Data
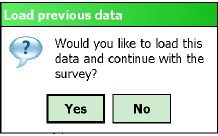
Figure 65: Load Previous Data
Exit Live Readings:
When tapped, causes the GK-604D to prompt to save survey data, shuts down the Remote Module (reel), then exits the Live Readings screen.
As with the Context menu (see Section 4.2.1), tapping the Edit Settings menu will invoke the Settings Editor for the currently selected Project Explorer element (See Section 5 for more information on settings).
This feature requires an active connection to a Remote Module and will attempt to connect the module when invoked. If a connection cannot be made, the window shown in Figure 66 will be displayed.

Figure 66: Remote Module Connection Problem
If a connection can be made, the window shown in Figure 67 is displayed. Using the "Terminal Window" requires the use of the on-screen keyboard to enter simple one- or two-character commands to the Remote Module. (See Appendix D for more information regarding the Remote Module command structure.)
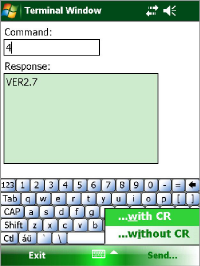
Figure 67: Terminal Window
After typing in a command, tapping the "Return" (Enter) key will cause the command to be sent to the Remote Module. Figure 67 shows the response to a Firmware Version command (4). Alternately, tapping the Send menu gives the user the ability to send a character to the Remote Module with or without a Carriage Return (CR) appended to the character string (see bottom right of Figure 67). This is useful when a confirmation character is required (such as for the calibration routine) but no carriage return.
This displays an information panel giving copyright information as well as the application version (Figure 68). Tapping on the Remote Module Status button will display another screen asking if a probe is connected to a Remote Module and is the Remote Module ready to connect (blue light blinking) (Figure 69).

Tapping the Yes button causes the GK-604D IRA to initiate the connection process with the Remote Module. If the connection is successful, the status available for a digital Remote Module and probe will be displayed (Figure 70).
Note: When using obsolete analog systems, only the Remote Module version and battery voltage is listed.
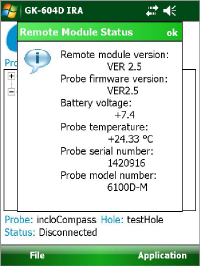
Figure 70: Remote Module/Probe Status
This screen allows selecting options that affect how the system works and how a survey is taken (Figure 71). The subsections that follow describe each parameter in detail.
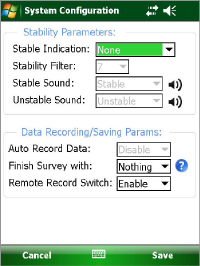
Figure 71: System Configuration
Valid choices for this selection include:
None:
When this stability indication is selected, the only indication on the Live Readings Screen of the reading's stability will be to monitor the A and B readings (Figure 72).
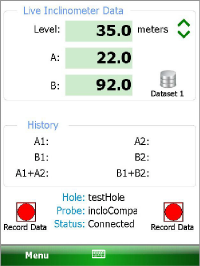
Figure 72: Live Reading, No Stability Indication
Visual Only:
When this stability indication is selected, an icon is displayed on the Live Readings Screen, indicating whether the reading is stable  or not
  (Figure 73 and Figure 74).
When this stability indication is selected, in addition to the icon shown in Figure 73 and Figure 74, an audible indication is played indicating the reading's stability or instability.
Selecting Visual/Audible will enable the dropdown lists for "Stable Sound" and "Unstable Sound" in Figure 71. These lists display the choices of sounds that the HHD can make when the reading in the "Live Readings" screen is determined to be stable or unstable.
Tapping  plays a preview of the actual sound heard.
Stability Filter
If the "Stable Indication" (see Stable Indication) selection is set to something other than "None", this parameter will be enabled, and a dropdown list will facilitate the entry of a number that is used to determine readings stability (a value less than 10 is recommended).
When taking live readings, if the difference between two subsequent readings of the A and B channels are less than or equal to the "Stability Filter" then the reading will be deemed stable and, if enabled, the Stability Indication icon (see Figure 73 and Figure 74) will be set accordingly.
Auto Record Data
If this selection is set to "Enable", upon entry into the Live Readings screen, the Auto Record feature will be enabled (Figure 75).
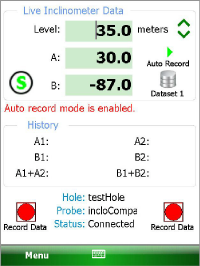
Figure 75: Auto Record Enabled
To activate the Auto Record feature, tap the  icon. The green Play icon above "Auto Record" changes to a red Pause icon and the red text status message will change to "Auto record mode is active". If the readings are stable, the first reading will automatically be recorded (see Figure 76).

Figure 76: Auto Record Active
The list of steps below illustrates the proper way to utilize the "Auto Record" feature. For the purpose of this example, the following is assumed:
The handheld device is connected via Bluetooth to the Remote Module
■In System Configuration, the "Stable Indication" parameter is set to "Visual/Audible" and the "Auto Record Data" parameter is set to "Enable" (see Figure 71).
■At the start of an "Auto Record" sequence, the probe should be down the casing at the starting level, in the A+ orientation.
Note: An "Auto Record" survey can be paused at any time and restarted as long as the probe is moved to the proper level reflected by the "Level:" display. When an Auto Record survey is paused, the data can still be recorded in the "normal" fashion by tapping the Record Data buttons.
1.Tapping the Live Readings menu item displays the screen shown in Figure 75.
2.As in the normal operation, readings are continuously updated from the remote. The data set always starts with "Dataset 1" (can be switched at any time to "Dataset 2"). At the start, the "Level" is set to the "Starting Level", previously set in the Hole Settings screen (see Section 5.1).
3.Tap the icon to activate the Auto Record feature. The red status text message will change to "Auto record mode is active" and the green Play icon will change to the red Pause icon. If the readings are stable, the initial A & B readings will be taken and a beep sound should be heard, confirming that the readings have been stored. If no beep is heard, tap the volume control at the top of the screen and adjust the volume.
4.By pulling on the inclinometer cable, move the probe to the next level, ensuring that the cable marker/ferrule sits just above the cable grips in the pulley assembly, (or securely in the cable hold if one is used). Approximately one second after moving the probe, the system will determine that the readings are no longer stable. The stability icon will be set to its unstable state  and the "Unstable" sound selected in the System Configuration screen (see Figure 71) will be played.
5.Approximately two seconds after the cable marker/ferrule is locked in the cable grips, (or cable hold), the system will determine that the readings are again stable and respond by setting the stability icon to its stable state  and the "Stable" sound selected in the System Configuration screen (see Figure 71) will be played. Immediately following the stable sound, the current readings are stored, the "beep" sounds, and the level is decremented by the preselected interval.
6.Repeat steps four and five until all the A+ readings have been taken.
7.Tap the Dataset 1 icon and observe that the red status text message will change to "Auto record mode is paused" and the Pause icon will change to the Play icon while "Dataset 1" becomes "Dataset 2" (see Figure 77).
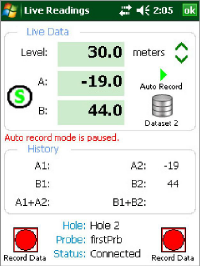
Figure 77: Auto Record Paused, Dataset Two Selected
8.After rotating the probe 180 degrees, lower it back to the "Starting Level" appropriate for this hole. Repeat step three.
9.Repeat steps four and five until all the "A-" readings have been taken.
When done taking readings, tap the Menu item (bottom-left corner of the screen), followed by "Exit Live Readings". You will be given the option to save the readings to a file (see Figure 78).
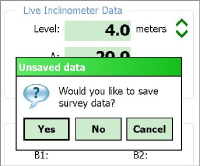
Figure 78: Unsaved Data Prompt
10.Even if "No" is selected, the readings will be saved to a temporary file and can be restored the next time the Live Readings screen is entered.
11.If "Yes" is selected, then another dialog box will be displayed giving the choice of saving with the auto-increment suffix on the standard filename (see Figure 79). Selecting "Yes" again causes the save operation to be carried out using a filename of the form: [Hole_Name][3 digit AutoIncr_Suffix].GKN
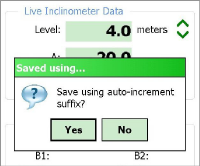
Figure 79: Auto Increment Save
If "No" is selected (to the auto incrementing option) the standard File Save As screen (see Figure 80) will be shown giving the option of modifying the file name to another name of the user's choosing. Use the stylus to click on the keyboard icon (bottom) and make the changes desired.

Figure 80: Save File Screen
This parameter (set in the System Configuration Screen, Figure 71) deals exclusively with "unfinished" survey data files. A survey is unfinished if readings were not taken at each level from starting up to the zero level. Many surveys may not completely finish because the geometry of the probe will not allow the last reading or two to be taken while the probe is still in the casing.
Valid choices for this selection include:
Nothing:
The survey will not be filled in and will remain unfinished. "READINGS" will be modified to reflect the actual number taken. See Figure 81.
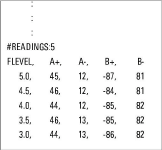
Figure 81: Readings Updated to Reflect Number Taken
NaN(s):
Each missing level "row" of the survey will be filled in with "NaN(s)" which is the floating-point representation of a non-numerical value. NaN is an abbreviation for "Not a Number". See Figure 82.
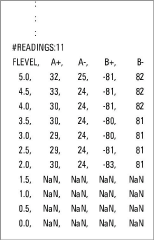
Figure 82: Survey Filled with NaN(s)
Blanks:
Each missing level "row" of the survey will be filled in with blank characters. See Figure 83.
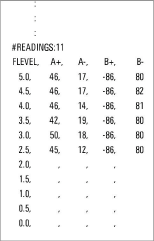
Figure 83: Missing Rows Filled with Blank Characters
Remote Record Switch:
If this parameter is "Enabled", an auxiliary switch can be used to record data points without having to tap the Record Data buttons on the Nautiz screen. A "remote" "Record Data" event is triggered by shorting pins seven and eight of the RS-232, DB-9 connector (see Figure 84) on the Nautiz.
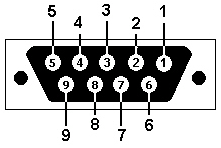
Figure 84: Male DB-9 Housing (Female Pins)
The file menu (see Figure 85) is used to import and export Project Explorer element settings along with data export, viewing and report generation. It also is used to fully delete and/or restore previous deleted Project Explorer elements.
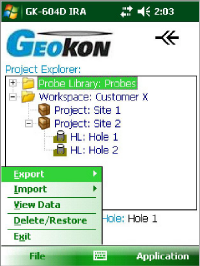
Figure 85: File Menu
The Export menu (see Figure 86) is used to export hole data and Project Explorer element settings to a folder of the user's choosing.
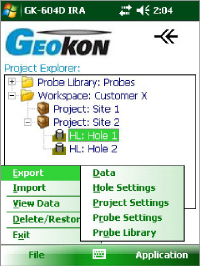
Figure 86: Export Menu
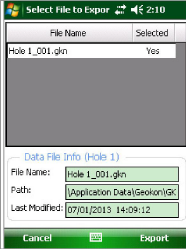
The Export Data menu allows exporting of data from the current hole, either selected via the Project Explorer or listed in the status area. Figure 87 shows the files available for hole, "Hole1". A file may be selected by tapping and holding on the file name. When a context menu is displayed, tap "Select" to select the file for exporting. Multiple files may be selected. Once all the desired files are selected, tap "Export" to display the Save File window (Figure 88) where a new name and folder may be specified for each file.
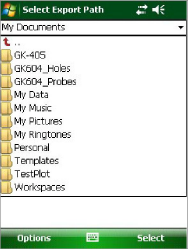
Clicking on this menu item displays the "Select Export Path" window (see Figure 89), from which a path to export the hole settings file can be selected. All files within the hole element folder are compressed into a single export file. The naming format for the hole export file is: <Selected Path> + <Hole Name> + ".lvhe"
Clicking on this menu item displays the "Select Export Path" window (see Figure 89), from which a path to export the project settings file can be selected. All files within the project are compressed into a single export file. The naming format for the project export file is: <Selected Path> + <Project Name> + ".lvpe"
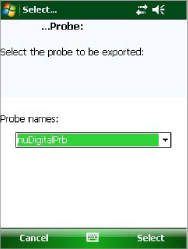
Clicking on this menu item displays the "Select… …Probe" window (see Figure 90), from which a probe can be selected. After selecting a probe, the "Select Export Path" window (see Figure 89) is displayed, from which a path to export the probe settings file can be selected. The naming format for the probe export file is:
<Selected Path> + <Probe Name> + ".gkpe"
Clicking on this menu item displays the "Select Export Path" window (see Figure 89), from which a path to export the probe library files can be selected. All files and folders within the probe library are compressed into a single export file. The naming format for the probe library export file is: <Selected Path> + <Probe Library Name> + ".gple"
The Import menu is used to import Project Explorer element settings (see Figure 91) that were previously exported using the Export menu functions (see Figure 86).
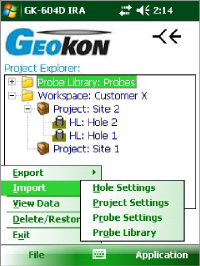
Figure 91: Import Menu
Import Hole Settings
Clicking on this menu item displays the "Select .LVHE File" window (see Figure 92), from which a hole export file can be selected (see Export Hole Settings). After selection, a new "Hole" will be created in the currently selected project. This new "Hole" will contain all the settings and any data files that were contained in the hole export file. If a hole with the same name already exists in the currently selected project a message will be displayed, and the hole import will be cancelled.
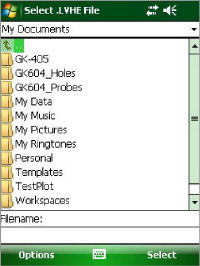
Figure 92: Select Hole Export File
Import Project Settings
Clicking on this menu item displays the "Select .LVPE File" window (see Figure 93). Select a project export file (see Export Project Settings) to create a new "Project" in the current workspace. This new project will contain all the settings and any "holes" that were contained in the project export file. If a project with the same name already exists in the current workspace, a message will be displayed, and the project import will be cancelled.
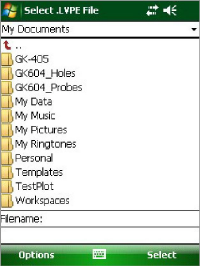
Figure 93: Select Project Export File
Import Probe Settings
Clicking on this menu item displays the "Select .GKPE File" window (see Figure 94). Select a probe export file (see Export Probe Settings) to create a new "Probe" in the current probe library. This new probe will contain all the settings that were contained in the probe export file. If a probe with the same name already exists in the current probe library, a message will be displayed, and the probe import will be cancelled.
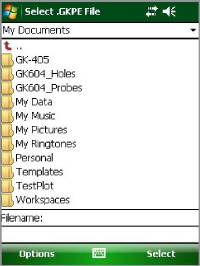
Figure 94: Select Probe Export File
Import Probe Library
Clicking on this menu item displays the "Select .GPLE File" window (see Figure 95), from which a probe library export file can be selected (see Export Probe Library).

Figure 95: Probe Library Export File
After selection, a message query will be displayed (see Figure 96) asking the user if they would like to make the imported probe library the current one. Answering "Yes" to the query will replace the current probe library with the imported probe library. Answering "No" will simply add the new probe library to the list of probe libraries that the GK-604D IRA keeps track of. The new probe library can be "switched" to at a later date.
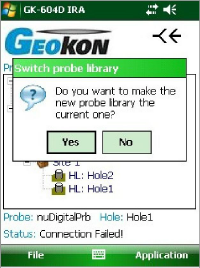
Figure 96: Probe Library Switch
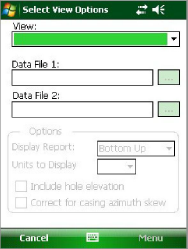
When the View Data menu is clicked, the screen displayed in Figure 97 displays. The Select View Options screen (see Figure 98) is used to select a view option and data files to view a graphical or tabular report. The available "View" options are explained in the following subsections.
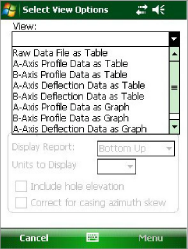
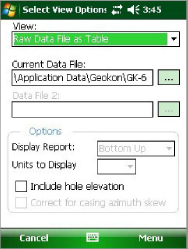
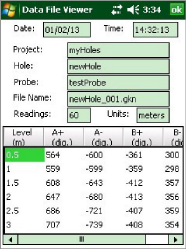
Raw Data File as Table
This selection will cause the selected "hole" raw data to be displayed or saved in tabular form. Figure 99 shows the available options for any report. Figure 100 illustrates the report as viewed on the FPC-2 unit. See Appendix C for examples of reports saved in text form. Tabular reports may also be saved in comma-separated value (.csv) or "Text" (.txt) format.
Axis Profile Data as Table
Selecting this option allows viewing or saving hole profile data for the A or B-axis (see Figure 101). The profile is calculated from the magnitude of the readings at each level.
This report lists the profile of the casing calculated from the bottom of the casing upward or from the top down (see the Options pane in Figure 99). Tabular reports may also be saved in comma-separated value (.csv) or "Text" (.txt) format. (See Appendix C for an example of a profile report saved in text form.)
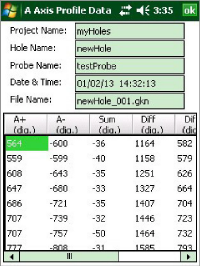
Figure 101: Axis Profile Report
Axis Deflection Data as Table
Selecting this option allows viewing or saving hole deflection data for the A or B-axis (see Figure 102). Deflection is determined from the accumulated change in deflection between the two selected data files at each level.
This report lists the deflection of the casing accumulated from the bottom of the casing upward or from the top down (see the Options pane in Figure 99). Tabular reports may be saved in comma-separated value (.csv) or "Text" (.txt) format. (See Appendix C for an example of a text format deflection report.)
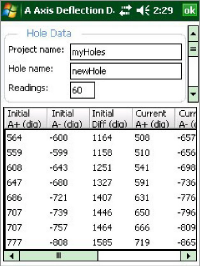
Figure 102: Axis Deflection Report
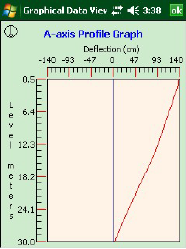
Axis Profile Data as Graph
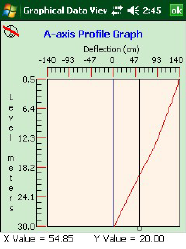
Selecting this option allows a graphical view of hole profile data and is useful for visualizing the actual installed characteristics (inclination, couplings, anomalies, etc.) of the casing. Figure 103 shows a typical profile plot. Tapping the icon in the upper-left corner of the plot (a circle with a vertical line), enables a "marker" line on the plot. Moving the marker line by tapping/dragging shows corresponding X and Y values below the plot (see Figure 104). Screenshots of graphical reports may be saved in ".bmp" format".
Axis Deflection Data as Graph
Displays a graphical view of hole deflection data for either axis (see Figure 105). This view is useful for visualizing magnitude and direction of any movement of the borehole. Screenshots of graphical reports may be saved in ".bmp" format".
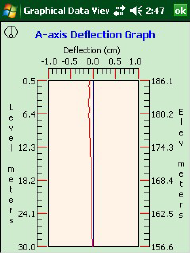
Figure 105: Deflection Plot
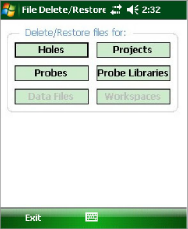
This menu allows Project Explorer elements to be permanently deleted or restored back to their original location. A special folder is reserved for storing project explorer elements that are deleted from a workspace. Data files from the currently selected hole can also be deleted. Tapping the Delete/Restore menu causes the GK-604D IRA to search this folder to see which elements are available for restoring or permanent deletion. As can be seen in Figure 106, there are holes, projects, probes and probe libraries that are stored in the special folder that can be either restored or permanently deleted. Tapping the Holes button in Figure 106 displays the window depicted in Figure 107.
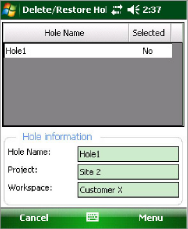
In each element delete/restore window, an element may be selected by tapping and holding on the element name. When a context menu is displayed, tap "Select" to select the file for deleting or restoring. Multiple files may be selected. Once all the desired files are selected, tap either "Delete" or "Restore" from the Menu options.
WARNING! Selecting "Delete" will permanently delete the selected element and later restoration will NOT be possible.
Tapping this menu item will cause the program to cease execution.